zabbix自定义图形
- 自带一些图形,cpu,内存等。检测–>主机–>图形
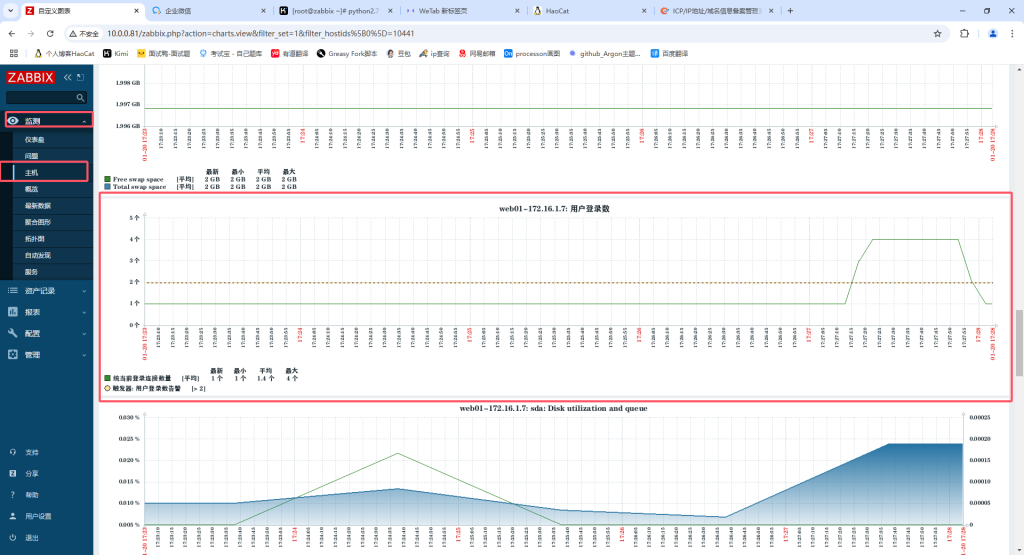
- 我们自己自定义的key就需要自定义图像
- 配置–>主机–>图形–>创建图表

- 可以一个图像监控多个动作

聚合图形
- 聚合图形:多个表放在一个图里
- 也可以图形幻灯片播放。监测–>聚合图形–>点击左上角聚合图形倒三角–>幻灯片演示–>创建幻灯片播放


自定义模版
- 为了简单批量添加资产,假如100台服务器
1.配置nginx七种状态检查模块
[root@web01 ~]# cat /etc/nginx/conf.d/wp.conf
server {
        listen 80;
        server_name _;
        root /code/wordpress;

        location / {
                index index.php index.html;
        }

        location ~ \.php$ {
                fastcgi_pass 127.0.0.1:9000;
                fastcgi_param SCRIPT_FILENAME $document_root$fastcgi_script_name;
                include fastcgi_params;
        #fastcgi_param HTTPS on;
        }

        location /nginx_status {
        stub_status on;
        }
}
[root@web01 ~]# cat /etc/zabbix_agentd.conf.d/nginx_status.conf
UserParameter=nginx_Active,curl -s 10.0.0.7/nginx_status | awk 'NR==1{print $NF}'
UserParameter=nginx_accepts,curl -s 10.0.0.7/nginx_status | awk 'NR==3{print $1}'
UserParameter=nginx_handled,curl -s 10.0.0.7/nginx_status | awk 'NR==3{print $2}'
UserParameter=nginx_requests,curl -s 10.0.0.7/nginx_status | awk 'NR==3{print $3}'
UserParameter=nginx_Reading,curl -s 10.0.0.7/nginx_status | awk 'NR==4{print $2}'
UserParameter=nginx_Writing,curl -s 10.0.0.7/nginx_status | awk 'NR==4{print $4}'
UserParameter=nginx_Waiting,curl -s 10.0.0.7/nginx_status | awk 'NR==4{print $6}'
2.web页面配置模版


- 下面用这个模版,关联nginx服务器
- 注意:这些kay底层要配置好,如果100台用ansible批量分发一下nginx_status.conf重启一下

多台web自动添加
- 使用ansible批量分发key重启zabbix-agent
[root@Ansible ~/nginx_web_zabbix/web/tasks]# cat main.yml
- hosts: web02
  tasks:
    - name: install zabbix-agent
      yum:
        name: zabbix-agent
        state: present

    - name: create directory
      file:
        path: /etc/zabbix_agentd.conf.d/
        state: directory

    - name: crate agent
      copy:
        src: "{{item.src}}"
        dest: "{{item.dest}}"
      loop:
        - { src: zabbix_agentd.conf , dest: /etc/ }
        - { src: nginx_status.conf , dest: /etc/zabbix_agentd.conf.d/}

    - name: nginx.repo
      copy:
        src: nginx.repo
        dest: /etc/yum.repos.d/

    - name: install nginx
      yum:
        name: nginx
        state: present

    - name: create nginx_status
      copy:
        src: wp.conf
        dest: /etc/nginx/conf.d/

    - name: rm default.conf
      file:
        path: /etc/nginx/conf.d/default.conf
        state: absent

    - name: restart nginx and zabbix-agent
      systemd:
        name: "{{ item }}"
        state: restarted
        enabled: yes
      loop:
        - nginx
        - zabbix-agent

php自定义监控模版
- 开启php状态监控,类似于nginx的stub_status on;模块
#1.开启php监控,重启服务
[root@web02 ~]# awk 'NR==240' /etc/php-fpm.d/www.conf
pm.status_path = /status
[root@web02 ~]# systemctl restart php-fpm

#2.配置nginx页面添加location /status区块,能页面监控php
[root@web02 /etc/nginx/conf.d]# cat wp.conf
server {
        listen 80;
        server_name _;
        root /code/wordpress;

        location / {
                index index.php index.html;
        }
        #添加一下这个location
        location /status {
                fastcgi_pass 127.0.0.1:9000;
                fastcgi_param SCRIPT_FILENAME $document_root$fastcgi_script_name;
                include fastcgi_params;

        location ~ \.php$ {
                fastcgi_pass 127.0.0.1:9000;
                fastcgi_param SCRIPT_FILENAME $document_root$fastcgi_script_name;
                include fastcgi_params;
    }
        location /nginx_status {
        stub_status on;
        }
}


#3.了解php监控变量的含义

[root@web02 ~]# curl 127.0.0.1:88/status
pool:                 www                          # pool的名称
process manager:      dynamic                      # 进程管理方式,现今大多都为dynamic,不要使用static
start time:           11/Nov/2021:10:11:53 +0800  # php-fpm上次启动的时间
start since:          282                          # php-fpm已运行了多少秒
accepted conn:        2                              # pool接收到的请求数
listen queue:         0                              # 处于等待状态中的连接数,如果不为0,需要增加php-fpm进程数
max listen queue:     0                              # 从php-fpm启动到现在处于等待连接的最大数量
listen queue len:     128                          # 处于等待连接队列的套接字大小
idle processes:       4                              # 处于空闲状态的进程数
active processes:     1                              # 处于活动状态的进程数
total processes:      5                              # 进程总数
max active processes: 1                              # 从php-fpm启动到现在最多有几个进程处于活动状态
max children reached: 0    # 当pm试图启动更多的children进程时,却达到了进程数的限制,达到一次记录一次,如果不为0,需要增加php-fpm pool进程的最大数
slow requests:        0 # 当启用了php-fpm slow-log功能时,如果出现php-fpm慢请求这个计数器会增加,一般不当的Mysql查询会触发这个值


#4.自定义php取值变量
[root@web02 /etc/zabbix_agentd.conf.d]# cat /etc/zabbix_agentd.conf.d/php.conf
UserParameter=php_idle,curl -s 127.0.0.1/status|awk '/^idle/{print $NF}'
UserParameter=php_ac,curl -s 127.0.0.1/status|awk '/^active/{print $NF}'
UserParameter=php_max,curl -s 127.0.0.1/status|awk 'NR==12{print $NF}'
UserParameter=php_chil,curl -s 127.0.0.1/status|awk 'NR==13{print $NF}'
[root@web02 /etc/zabbix_agentd.conf.d]# systemctl restart zabbix-agent
[root@web02 /etc/zabbix_agentd.conf.d]# zabbix_agentd -p

#5.监控端检测
[root@zabbix ~]# zabbix_get -s 172.16.1.7 -k php_idle- 创建zabbix模版php_status

- 添加模版监控项、触发器、图像等

- 剩下的变量键值,克隆然后更改即可
php_idle
php_ac
php_max
php_chil

- 监控php端口9000

- 创建php存活触发器


- 创建php_status图形监控

- 主机添加创建的这个模版

- 测试[root@zabbix ~]# ab -n20000 -c200 172.16.1.1/staus
使用脚本自定义取值
#1.脚本内容
[root@web02 /etc/zabbix_agentd.conf.d]# cat nginx_status.sh
#!/bin/sh
case $1 in
    active)
        curl -s 127.0.0.1/nginx_status | awk 'NR==1{print $NF}'
        ;;
    accepts)
        curl -s 127.0.0.1/nginx_status | awk 'NR==3{print $1}'
        ;;
    handled)
        curl -s 127.0.0.1/nginx_status | awk 'NR==3{print $2}'
        ;;
    requests)
        curl -s 127.0.0.1/nginx_status | awk 'NR==3{print $3}'
        ;;
    *)
        echo "Usage: $0 [active|accepts|handled|requests]"
        ;;
esac


#2.脚本说明
这个脚本用于从 Nginx 获取状态信息。用户可以通过指定参数(如active、accepts、handled、requests)(脚本传参)来获取不同的统计数据。如果输入参数不正确,脚本会显示用法提示。

#3.命令行使用
[root@web02 /etc/zabbix_agentd.conf.d]# sh nginx_status.sh active
1
[root@web02 /etc/zabbix_agentd.conf.d]# sh nginx_status.sh requests
182776

#4.zabbix使用
客户端自定义变量:你输入的变量就是[*],让后[*]赋值给$1
[root@web02 /etc/zabbix_agentd.conf.d]# cat nginx_status.conf
UserParameter=nginx_status.[*],/etc/zabbix_agentd.conf.d/nginx_status.sh $1


#5.zabbix监控端测试,[*]
[root@zabbix ~]# zabbix_get -s 172.16.1.8 -k nginx_status.[active]
1
[root@zabbix ~]# zabbix_get -s 172.16.1.8 -k nginx_status.[handled]
183301- 如果更换完键值不能监控,在主机监控键值这里更新一下
